Acoustic Overlays
Visualize pitch, formants, intensity, and more
Overview
Acoustic overlays display computed measurements directly on the spectrogram, enabling visual analysis of prosody, voice quality, and spectral properties. Acoustic measurements are computed via WebAssembly.
Available Overlays
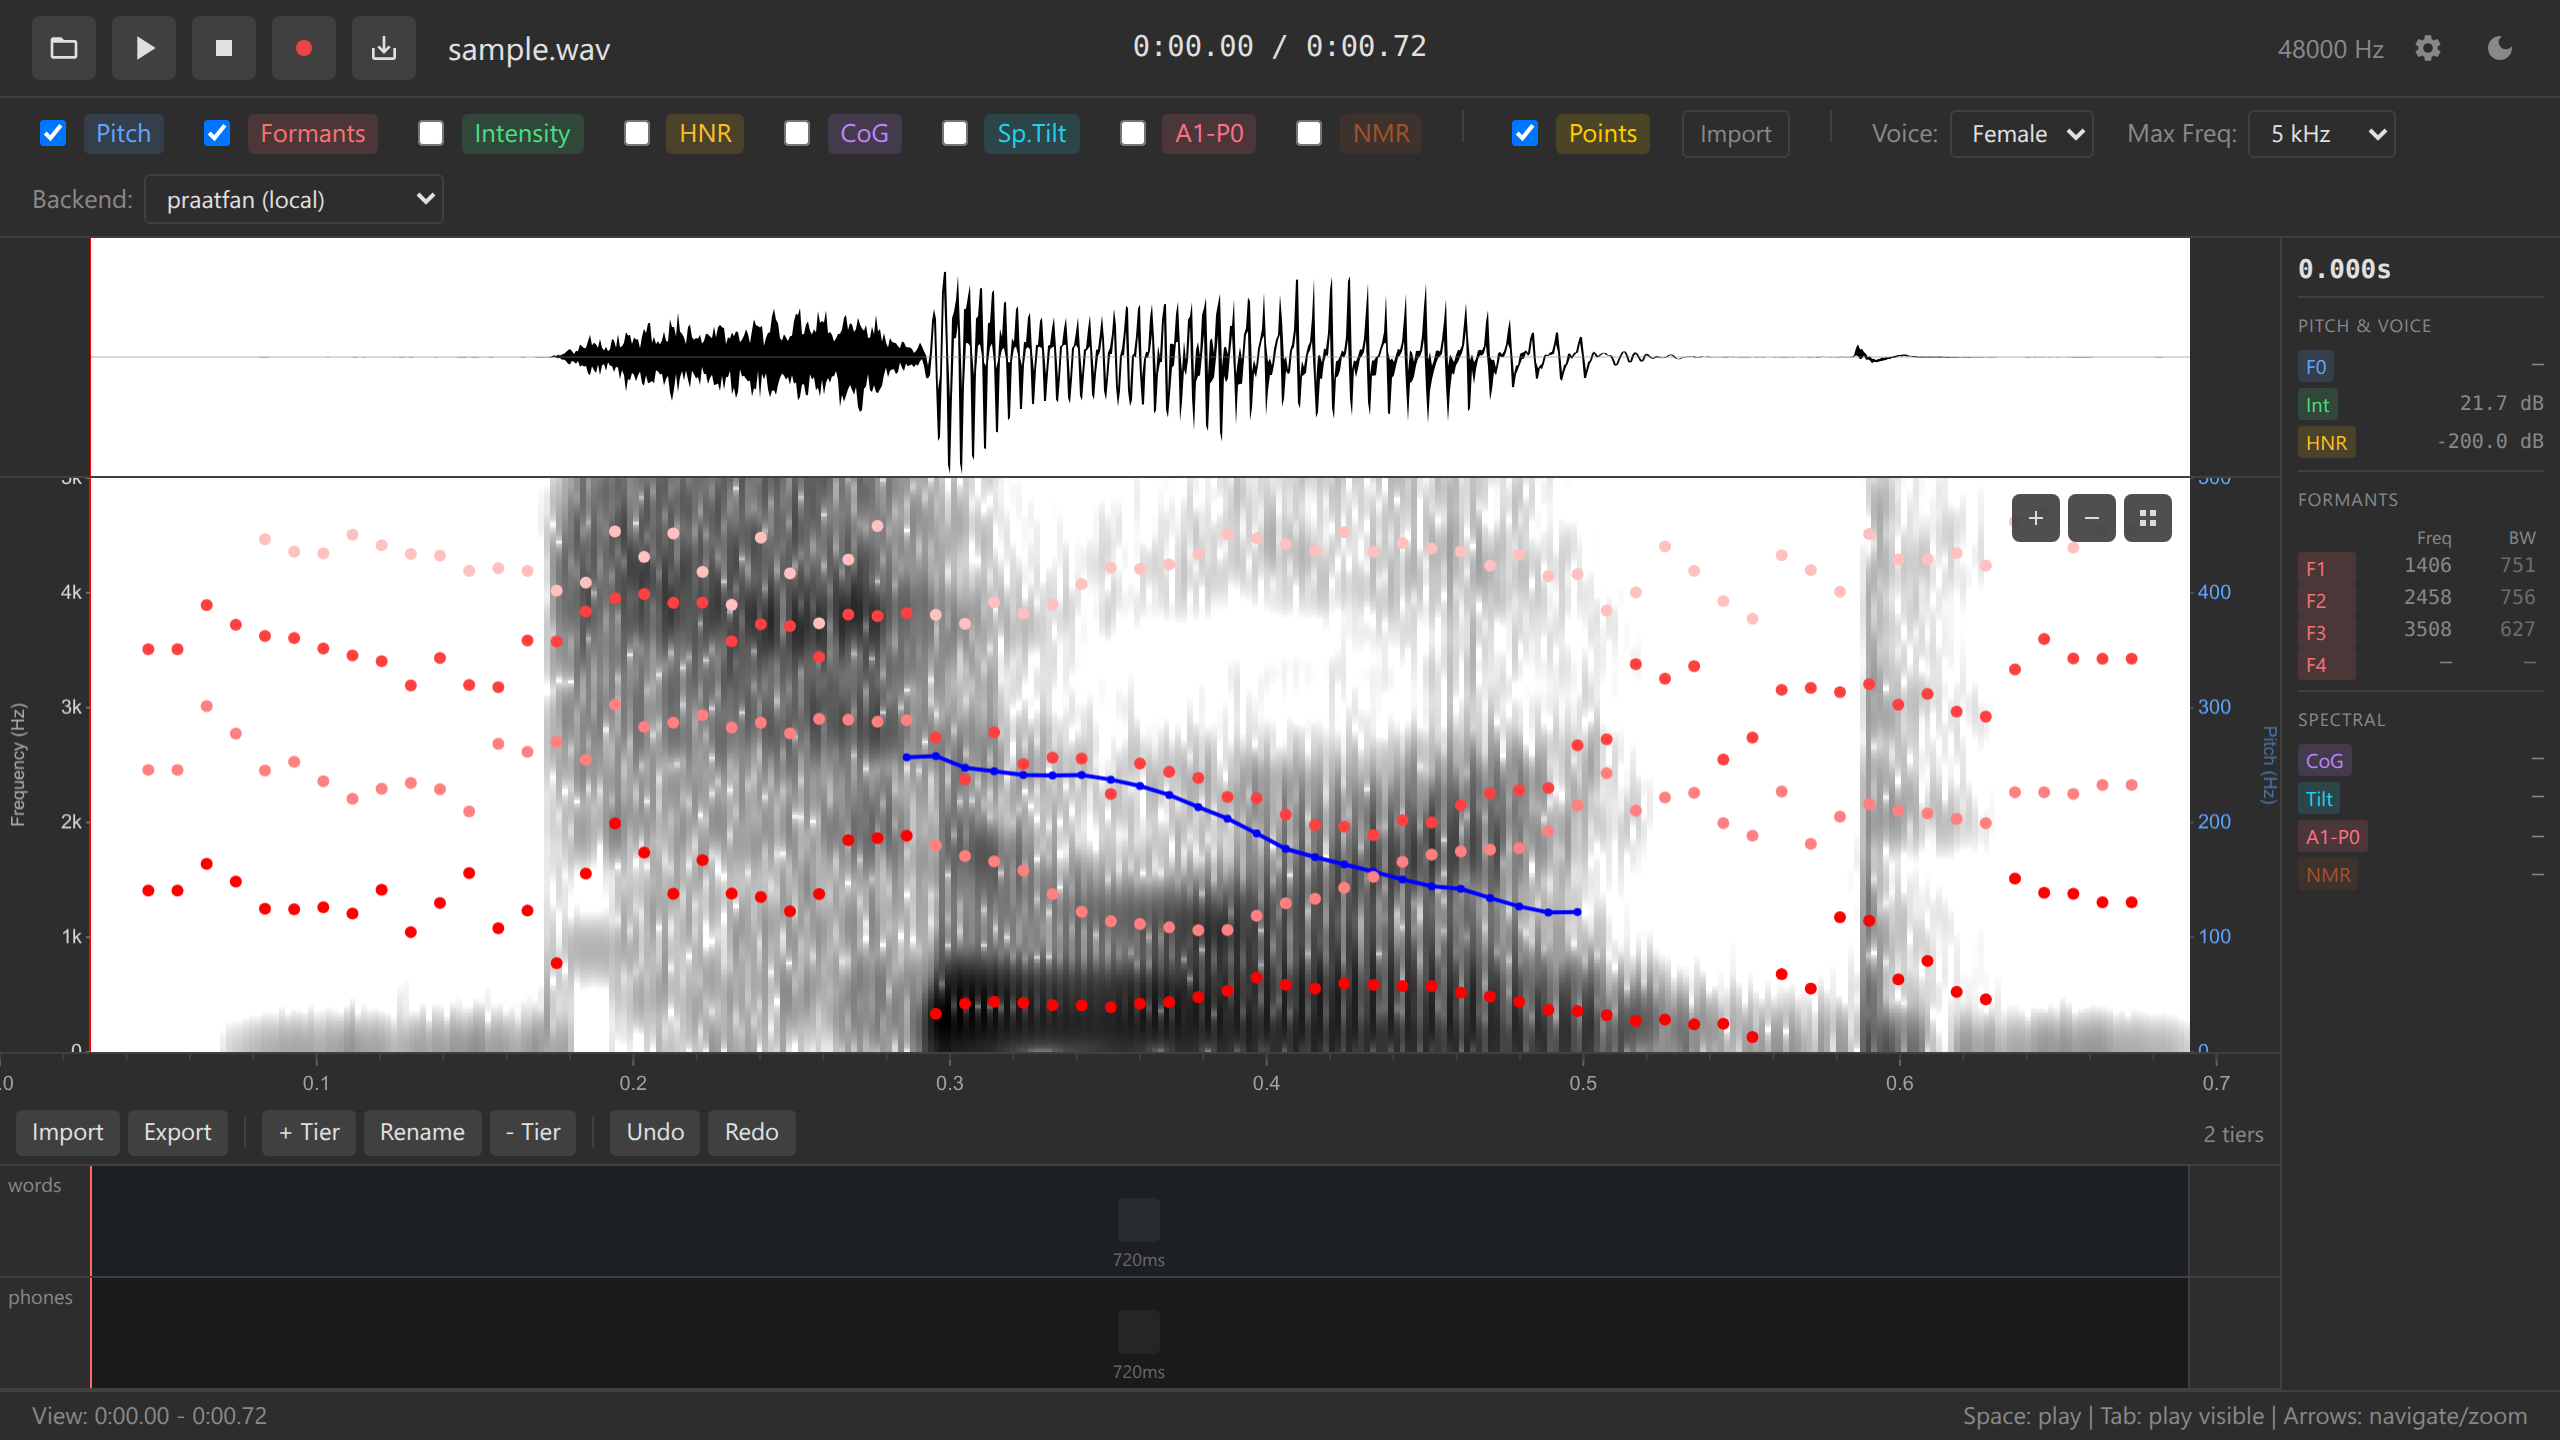
Pitch (F0)
Display: Blue line with dots
Fundamental frequency (F0) tracking shows vocal fold vibration rate, essential for analyzing intonation, tone, and stress patterns.
Parameters: - Range: 75-600 Hz (default, adjustable for speaker) - Time step: 10 ms - Algorithm: Praat autocorrelation method
Interpretation: - Higher pitch = higher blue line - Dots mark detected pitch points (unvoiced regions have no dots) - Missing segments indicate unvoiced sounds (like /s/, /t/, /k/)
Adjust pitch range for different speakers: - Adult male: 75-300 Hz - Adult female: 100-500 Hz - Children: 200-600 Hz
Configure via config.yaml or UI settings.
Formants (F1-F4)
Display: Red dots
Formant frequencies represent vocal tract resonances, critical for vowel identification and acoustic phonetics.
Parameters: - Number of formants: 5 (tracks F1-F4, ignores F5) - Max formant: 5500 Hz (female), 5000 Hz (male) - Time step: 10 ms - Pre-emphasis: 50 Hz
Display: - F1 (lowest red dots) - Vowel height (high vowels = low F1) - F2 (second row) - Vowel frontness/backness - F3, F4 (upper rows) - Rhotic/retroflex indicators
Formant Presets:
| Preset | Max Formant | Num Formants | Use Case |
|---|---|---|---|
| Male | 5000 Hz | 5 | Adult male speech |
| Female | 5500 Hz | 5 | Adult female speech |
| Child | 6500 Hz | 5 | Children’s voices |
Formant tracking may be inaccurate for: - Very high-pitched voices - Noisy recordings - Non-modal phonation (creaky voice, breathy voice) - Nasalized vowels
Always verify formant values against auditory perception.
Intensity
Display: Green line
Intensity (loudness) measured in dB SPL (sound pressure level), useful for identifying stressed syllables and amplitude modulation.
Parameters: - Minimum pitch: 75 Hz (for period detection) - Time step: 10 ms - Smoothing: Yes (Praat default)
Interpretation: - Higher green line = louder sound - Peaks often correspond to vowels - Valleys correspond to consonants or silence
Harmonics-to-Noise Ratio (HNR)
Display: Cyan line
HNR measures voice quality by comparing periodic (harmonic) energy to aperiodic (noise) energy.
Parameters: - Minimum pitch: 75 Hz - Time step: 10 ms - Silence threshold: 0.1
Interpretation: - High HNR (>20 dB): Clear, modal voice - Medium HNR (10-20 dB): Normal voice with slight breathiness - Low HNR (<10 dB): Breathy, creaky, or pathological voice
HNR is useful for: - Distinguishing modal vs. non-modal phonation - Detecting voice disorders - Analyzing consonant voicing - Comparing voice quality across speakers
Center of Gravity (CoG)
Display: Orange line
Spectral center of gravity indicates where spectral energy is concentrated, useful for fricative and sibilant analysis.
Interpretation: - High CoG (>6000 Hz): Alveolar fricatives (/s/, /z/) - Medium CoG (3000-6000 Hz): Postalveolar fricatives (/ʃ/, /ʒ/) - Low CoG (<3000 Hz): Dental/interdental fricatives (/θ/, /ð/)
Spectral Tilt
Display: Purple line
Spectral tilt measures the slope of the spectrum, indicating voice quality and phonation type.
Interpretation: - Negative tilt: More energy in high frequencies (breathy voice, /h/) - Near-zero tilt: Balanced spectrum (modal voice) - Positive tilt: More energy in low frequencies (creaky voice)
A1-P0
Display: Pink line
A1-P0 (amplitude of first harmonic minus amplitude of first formant) measures nasalization and voice source characteristics.
Interpretation: - Negative values indicate nasal coupling - Useful for detecting nasal consonants and nasalized vowels
Toggling Overlays
Via UI Checkboxes
Click checkboxes in the overlay panel:
Multiple overlays can be enabled simultaneously.
Via URL Parameters
Pre-configure overlays when embedding the mobile viewer:
<iframe src="https://ucpresearch.github.io/ozen-web/viewer?overlays=pitch,formants,intensity">
</iframe>
See Mobile Viewer Embedding and URL Parameters for details.
Values Panel
Hover over the spectrogram to see overlay values at the cursor position:
Time: 1.234 s
Freq: 523 Hz

Pitch: 245 Hz
Intensity: 68 dB
F1: 720 Hz  B1: 80 Hz
F2: 1240 Hz B2: 110 Hz
F3: 2650 Hz B3: 150 Hz
F4: 3500 Hz B4: 200 Hz
HNR: 15.3 dB
CoG: 5420 Hz
See Values Panel for details.
Performance
Overlays are computed on-demand when toggled. Once computed, values are cached for redrawing.
Configuration
Customize overlay parameters via config.yaml:
pitch:
  floor: 75        # Minimum pitch (Hz)
  ceiling: 600     # Maximum pitch (Hz)
  timeStep: 0.01   # Analysis step (seconds)

formantPresets:
  male:
    maxFormant: 5000
    numFormants: 5
  female:
    maxFormant: 5500
    numFormants: 5
  child:
    maxFormant: 6500
    numFormants: 5

intensity:
  minimumPitch: 75
  timeStep: 0.01
See Configuration Reference for all options.
Troubleshooting
Pitch Track Missing
Problem: No blue dots visible
Possible causes: - Audio is unvoiced (normal for fricatives, stops) - Pitch range set incorrectly for speaker - Very noisy recording
Solution: - Adjust pitch floor/ceiling for speaker - Check if audio is actually voiced - Try different time region
Formants Look Wrong
Problem: Red dots appear in unexpected locations
Possible causes: - Wrong formant preset (male/female/child) - Nasalized vowels - Non-modal phonation - Noise or artifacts
Solution: - Switch formant preset (Settings → Formant Preset) - Check audio quality - Verify with auditory analysis - Manually verify data point values
Overlays Not Computing
Problem: Overlay checkbox enabled but no visualization
Possible causes: - WASM not initialized - No audio loaded - Audio too long (>60s) and zoomed out
Solution: - Wait for WASM to load (status indicator) - Load audio file - Zoom in if file is long
Research Applications
Prosody Analysis
Use pitch and intensity overlays to study: - Intonation patterns - Lexical tone - Stress and emphasis - Question vs. statement contours
Vowel Formants
Use formant overlay to: - Create vowel plots (F1 vs. F2) - Track vowel formant trajectories - Identify vowel targets - Detect vowel coarticulation
Voice Quality
Use HNR, spectral tilt, and A1-P0 to: - Compare modal, breathy, and creaky voice - Detect pathological voice - Analyze phonation types across languages - Study laryngealization
Fricative Analysis
Use CoG and spectral tilt to: - Distinguish /s/ vs. /ʃ/ - Measure acoustic contrast - Study lenition processes - Compare speaker-specific productions
See Also
- Spectrogram - Base visualization
- Data Points - Collecting measurements
- Tutorial: Acoustic Analysis - Step-by-step guide
- Configuration - Customizing parameters