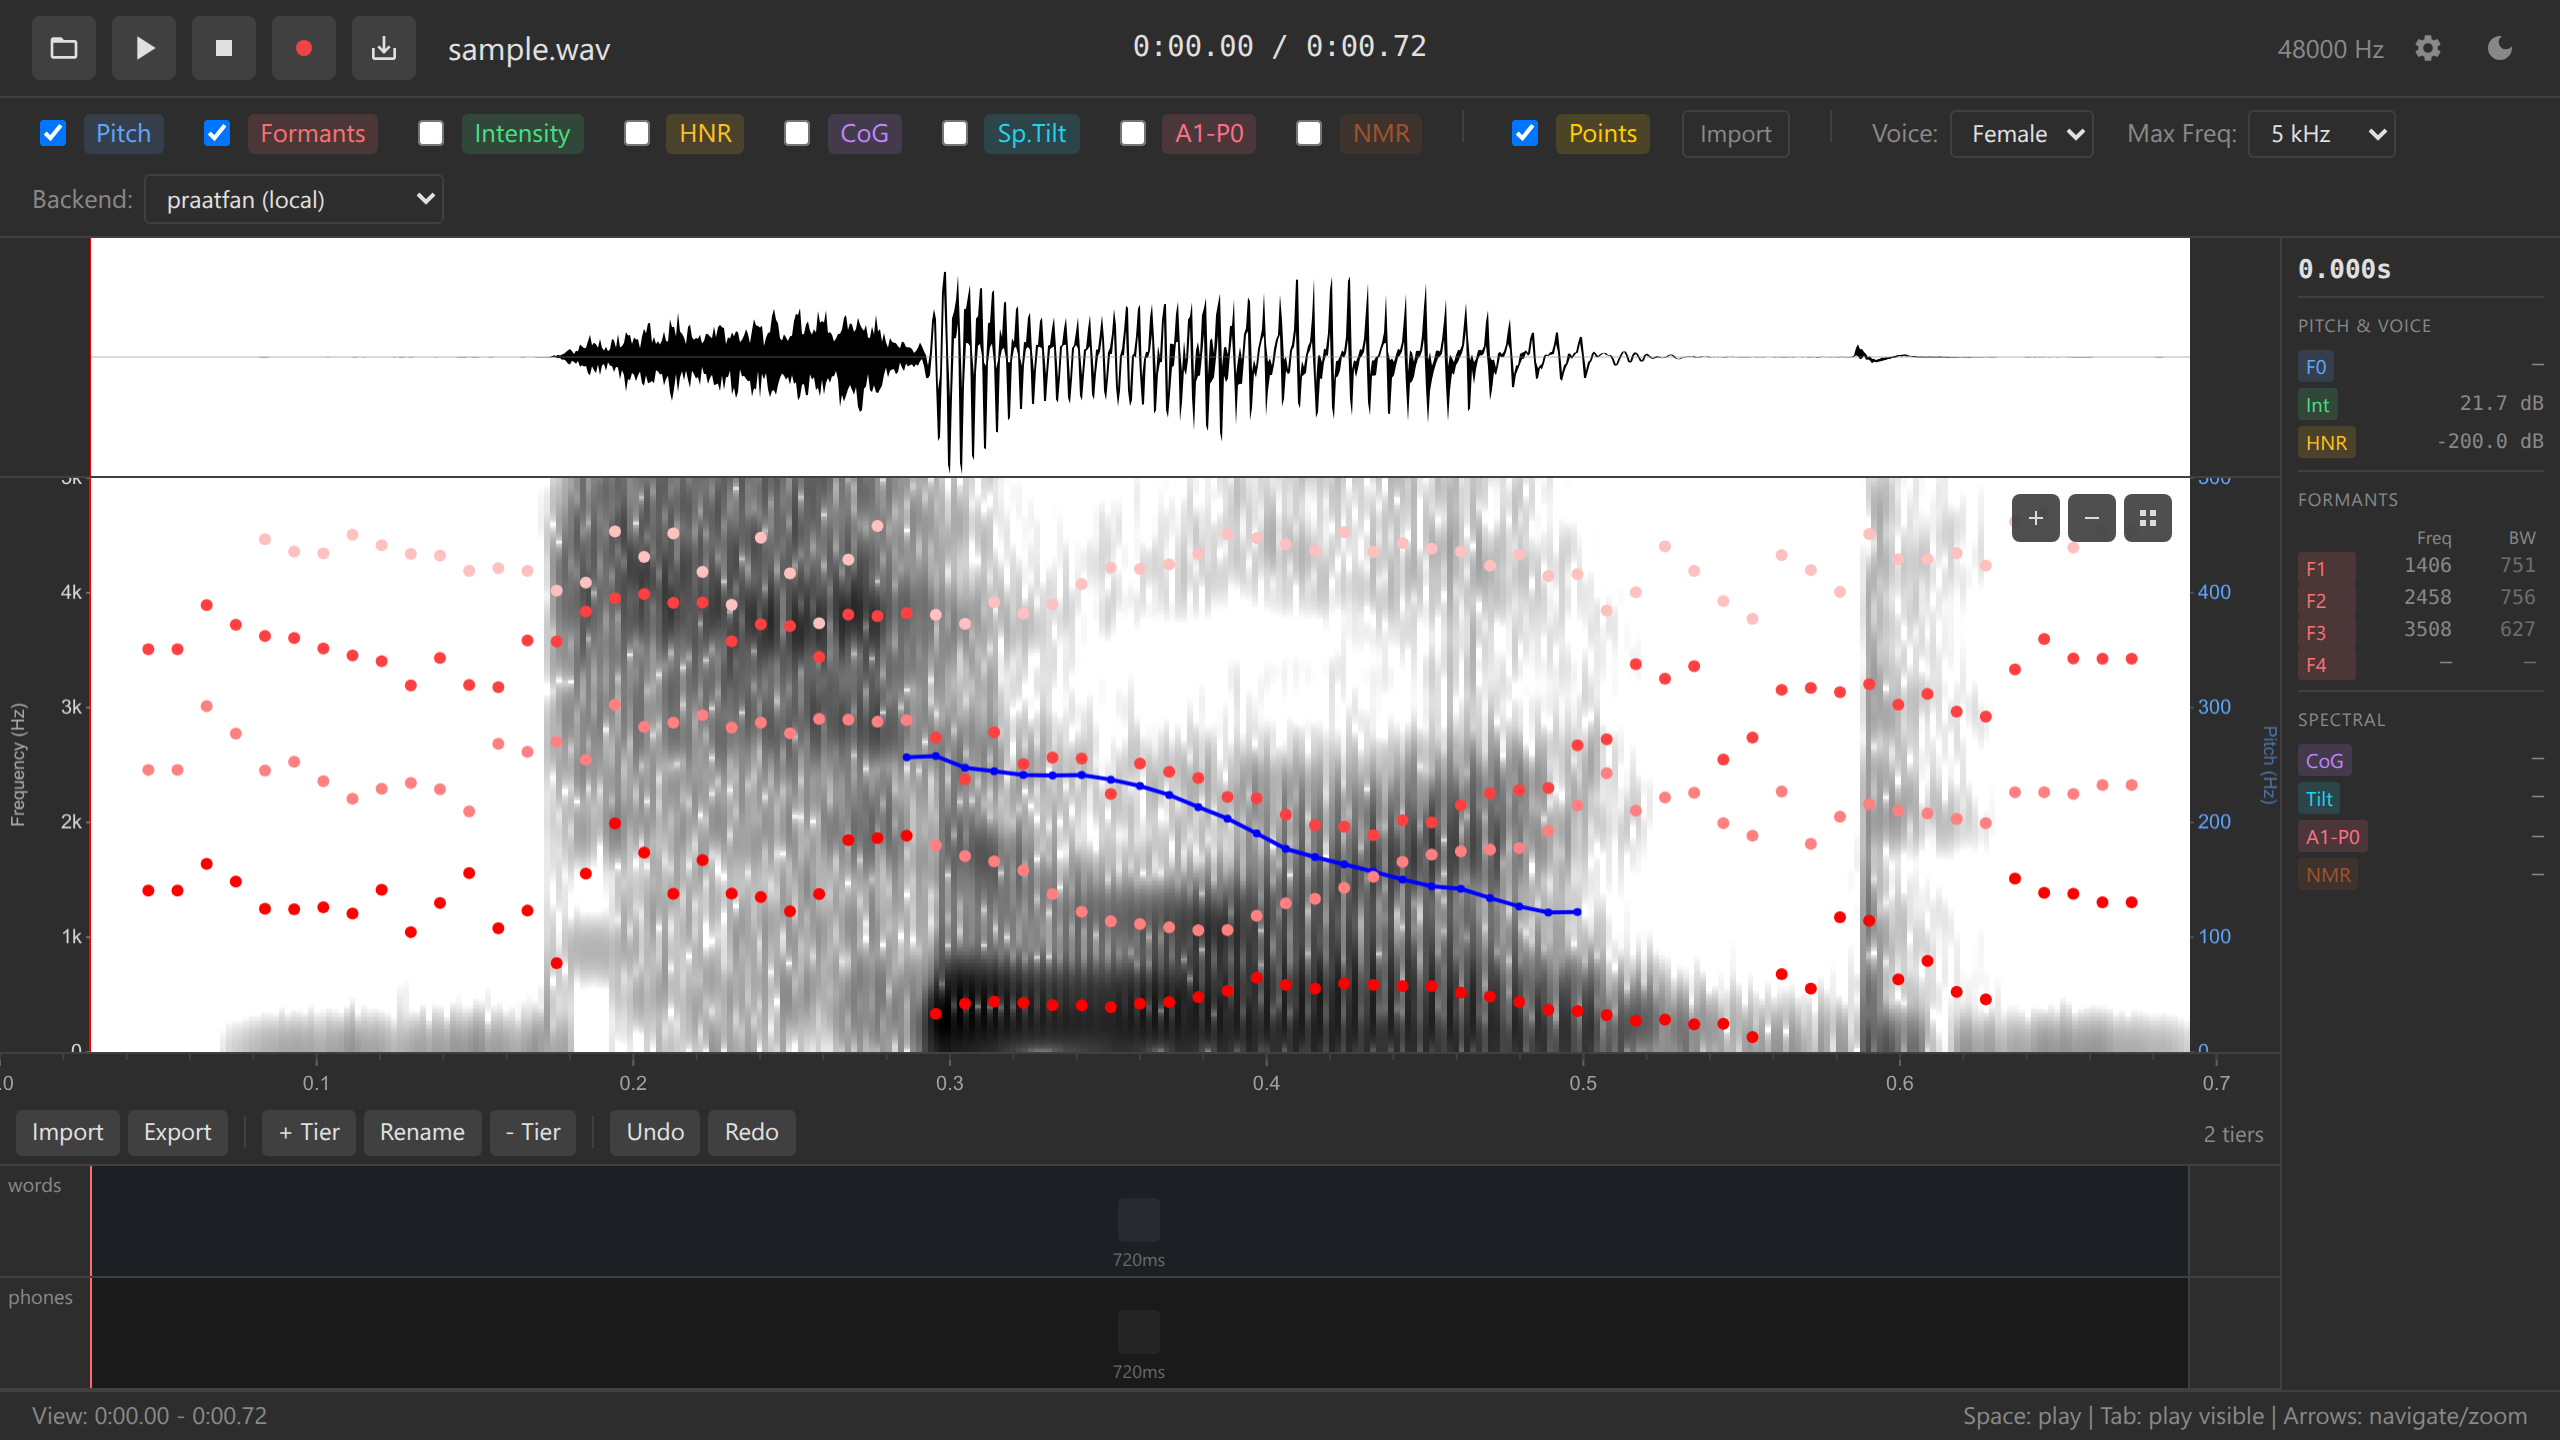
Spectrogram
High-resolution spectrogram visualization
Overview
The spectrogram displays frequency content over time, computed using Praat-accurate algorithms via WebAssembly. Ozen-web uses a grayscale colormap matching Praat’s default appearance, with resolution scaling.
Key Features
- Praat-accurate computation - Uses praatfan WASM for spectrograms
- Dynamic resolution - Automatically enhances detail when zoomed in
- Efficient caching - Stores computed spectrograms for redraw
- Configurable frequency range - Choose 5 kHz, 7.5 kHz, or 10 kHz maximum
- Long audio support - On-demand computation for files over 60 seconds
How It Works
Initial Computation
When audio is loaded, Ozen-web:
- Computes full spectrogram via WASM
to_spectrogram() - Applies grayscale colormap → converts to ImageData
- Caches to off-screen canvas for fast redraw
- Displays visible portion based on current time range
Dynamic Resolution Enhancement
When zoomed beyond 2x magnification, the spectrogram automatically regenerates at higher resolution for the visible window:
- Below 2x zoom: Uses cached full-length spectrogram
- Above 2x zoom: Regenerates high-res spectrogram for visible region (debounced 300ms)
- Long files (>60s): Only computes spectrogram for visible window
This provides more detail when examining specific regions while maintaining performance.
Caching Strategy
// Pseudocode
if (audioLoaded && visibleDuration <= 60s) {
  if (zoomLevel > 2x) {
    // High-resolution mode
    computeSpectrogramForRange(visibleStart, visibleEnd, highResSettings);
  } else {
    // Display cached full spectrogram
    drawCachedSpectrogram(visibleStart, visibleEnd);
  }
}
Settings
Max Frequency
Control the frequency range displayed (5,000 Hz, 7,500 Hz, 10,000 Hz)
For most speech analysis, 5000 Hz captures all relevant information. Use 7500-10000 Hz when analyzing:
- Children’s voices
- High-pitched vowels
- Fricative consonants (/s/, /ʃ/, /f/)
Spectrogram Parameters
Default settings (configurable via WASM):
| Parameter | Default | Description |
|---|---|---|
| Window length | 5 ms | Time window for each FFT |
| Time step | 2 ms | Hop size between windows |
| Frequency step | 20 Hz | Frequency resolution |
| Window shape | Gaussian | Spectral windowing function |
Long Audio Handling
For recordings longer than 60 seconds:
- On load: Waveform displays, spectrogram shows “Zoom in for spectrogram” message
- When zoomed to ≤60s visible window: Spectrogram computes for that region
- Debounced: 300ms delay prevents excessive recomputation during zoom/pan
This allows working with longer recordings without UI freezing.
- Load your multi-hour recording
- Use the waveform to navigate to regions of interest
- Zoom in to view detailed spectrogram
- Spectrogram automatically appears when window < 60 seconds
Overlays
The spectrogram can display multiple acoustic overlays simultaneously:
- Pitch track (blue line with dots)
- Formants F1-F4 (red dots)
- Intensity (green line)
- HNR (harmonics-to-noise ratio)
- Center of Gravity (spectral COG)
- Data points (yellow dashed lines)
See Acoustic Overlays for details.
Interaction
Visual Indicators
- Red vertical line - Current cursor position
- Blue rectangle - Selected time region
- Yellow dashed lines - Data collection points
- Colored dots/lines - Acoustic overlay tracks
Technical Details
Computation Backend
Spectrograms are computed using the selected WASM backend:
import { computeSpectrogram } from '$lib/wasm/acoustic';

const spectrogram = computeSpectrogram(
  sound,           // WASM Sound object
  0.005,          // windowLength (5 ms)
  5000,           // maxFrequency (Hz)
  0.002,          // timeStep (2 ms)
  20              // frequencyStep (Hz)
);

const info = getSpectrogramInfo(spectrogram);
// { nTimes, nFreqs, values, timeStep, freqStep, ... }
Colormap
Grayscale mapping matches Praat conventions:
- Black (0): High energy
- White (255): Low energy
- Linear scaling between min and max dB values
Canvas Rendering
The spectrogram uses HTML5 Canvas with ImageData:
- Compute spectrogram values (dB) via WASM
- Apply grayscale colormap:
gray = 255 - normalize(dB, min, max) - Create ImageData with RGBA values
- Draw to off-screen canvas
- Copy visible region to display canvas on zoom/pan
Troubleshooting
Spectrogram Not Appearing
Problem: “Zoom in for spectrogram” message displays
Solution: This is expected for files >60 seconds. Zoom in until visible window is ≤60 seconds.
Blurry or Low Resolution
Problem: Spectrogram looks pixelated when zoomed in
Solution: Zoom beyond 2x. The system automatically regenerates at higher resolution after 300ms.
Slow Performance
Problem: UI freezes when zooming/panning
Solution: - Close other browser tabs to free memory - Reduce max frequency (10 kHz → 5 kHz) - Use shorter audio files - Wait for debounced regeneration to complete
See Also
- Acoustic Overlays - Pitch, formants, intensity visualization
- Waveform - Amplitude-domain display
- Configuration - Customizing spectrogram settings
- Backends - WASM backend options