Mobile Viewer
Touch-optimized interface for phones and tablets
Overview
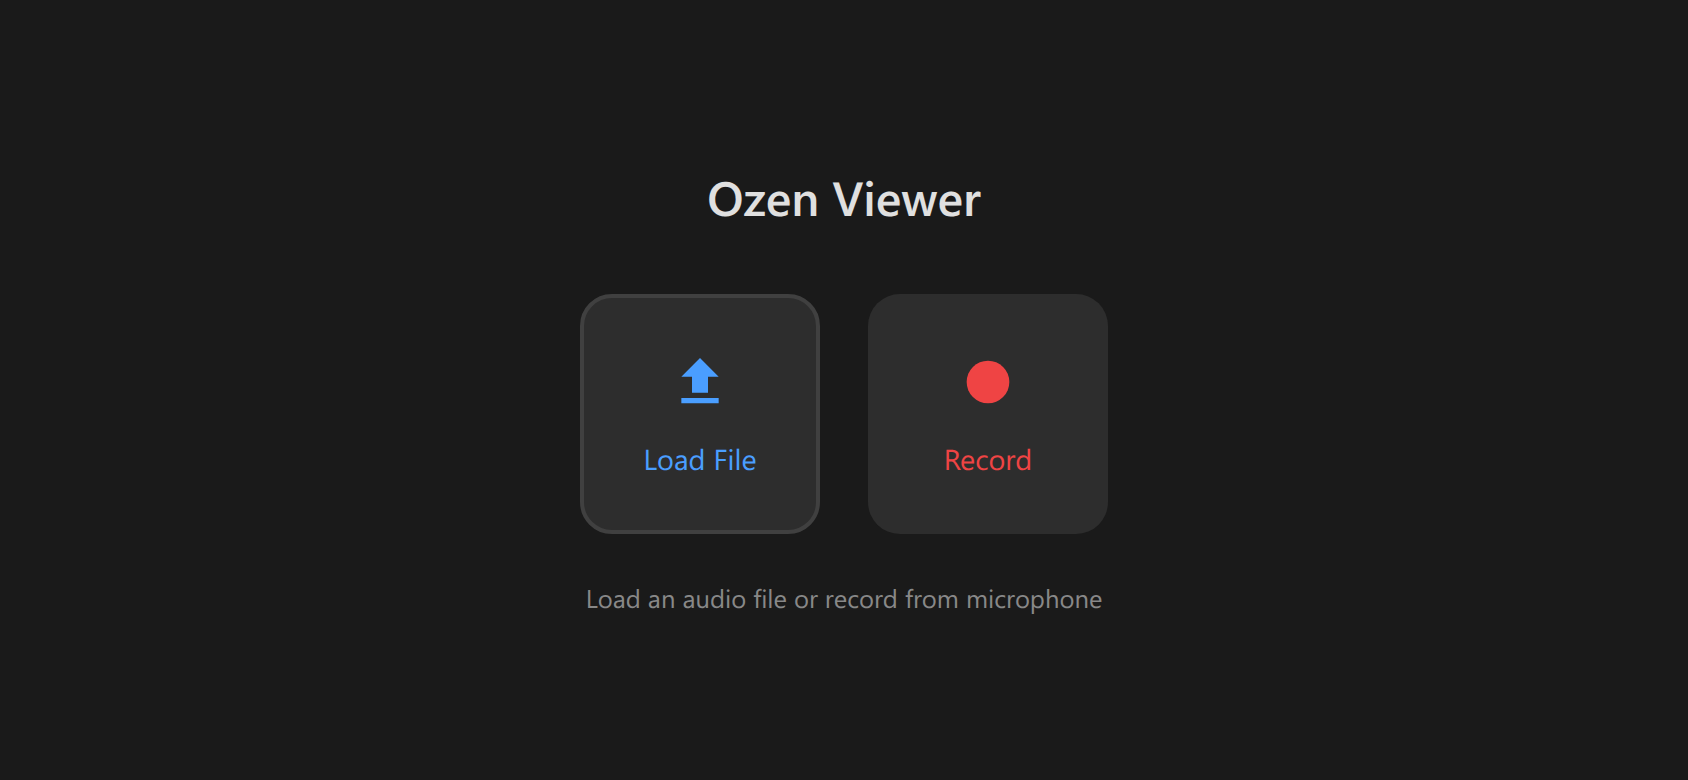
The mobile viewer (/viewer route) provides a touch-optimized, view-only interface designed for smartphones and tablets. It enables audio analysis on mobile devices with touch gestures for navigation and a streamlined UI.
Key Features
- Touch gestures - Tap, drag, pinch, two-finger pan
- Compact UI - Two-row values bar, minimal controls
- View-only mode - No editing (focused on analysis and presentation)
- URL loading - Load audio via
?audio=parameter - Pre-configured overlays - Set via
?overlays=parameter - Responsive - Works in portrait and landscape
- Safe area support - Handles iPhone notches and rounded corners
- CORS-enabled - Load audio from remote URLs
- Data URL support - Embed audio in URL for self-contained shares
Accessing the Mobile Viewer
Via URL
Navigate directly to the /viewer route:
https://ucpresearch.github.io/ozen-web/viewerWith Audio Pre-loaded
Use URL parameter to load audio automatically:
https://ucpresearch.github.io/ozen-web/viewer?audio=https://example.com/audio.wavWith Overlays Pre-configured
Specify which overlays to enable:
https://ucpresearch.github.io/ozen-web/viewer?audio=...&overlays=pitch,formants,intensitySee URL Parameters for complete documentation.
Touch Gestures
Tap
Single tap on spectrogram: - Places cursor at tap position - Shows values at that time/frequency - Clears selection if any
Drag (One Finger)
Horizontal drag: - Creates time selection (blue highlight) - Drag from start to end time - Release to finalize selection
Pinch (Two Fingers)
Pinch in/out: - Zoom in (pinch out) - Zoom out (pinch in) - Centered on midpoint between fingers
Two-Finger Drag
Pan horizontally: - Scroll left/right through time - Doesn’t create selection - Use when zoomed in
Long press on spectrogram
Copies the values of the visible overlays at that point.
- Pinch to zoom to desired time scale
- Two-finger drag to navigate to region of interest
- Tap to place cursor and view measurements
- Drag to select and play specific region
User Interface
Compact Values Bar
Two-row display shows key measurements:
Row 1: - Time (s) - Pitch (Hz) - Intensity (dB) - HNR (dB)
Row 2: - F1, F2, F3, F4 (Hz) - CoG (Hz)
Values update as you tap or drag across the spectrogram.
Settings Drawer
Swipe from right edge (or tap settings icon) to open drawer:
- Overlay toggles - Enable/disable acoustic overlays
- Max frequency - 5k / 7.5k / 10k Hz
- Backend selector - Choose WASM backend
Orientation Support
Portrait Mode
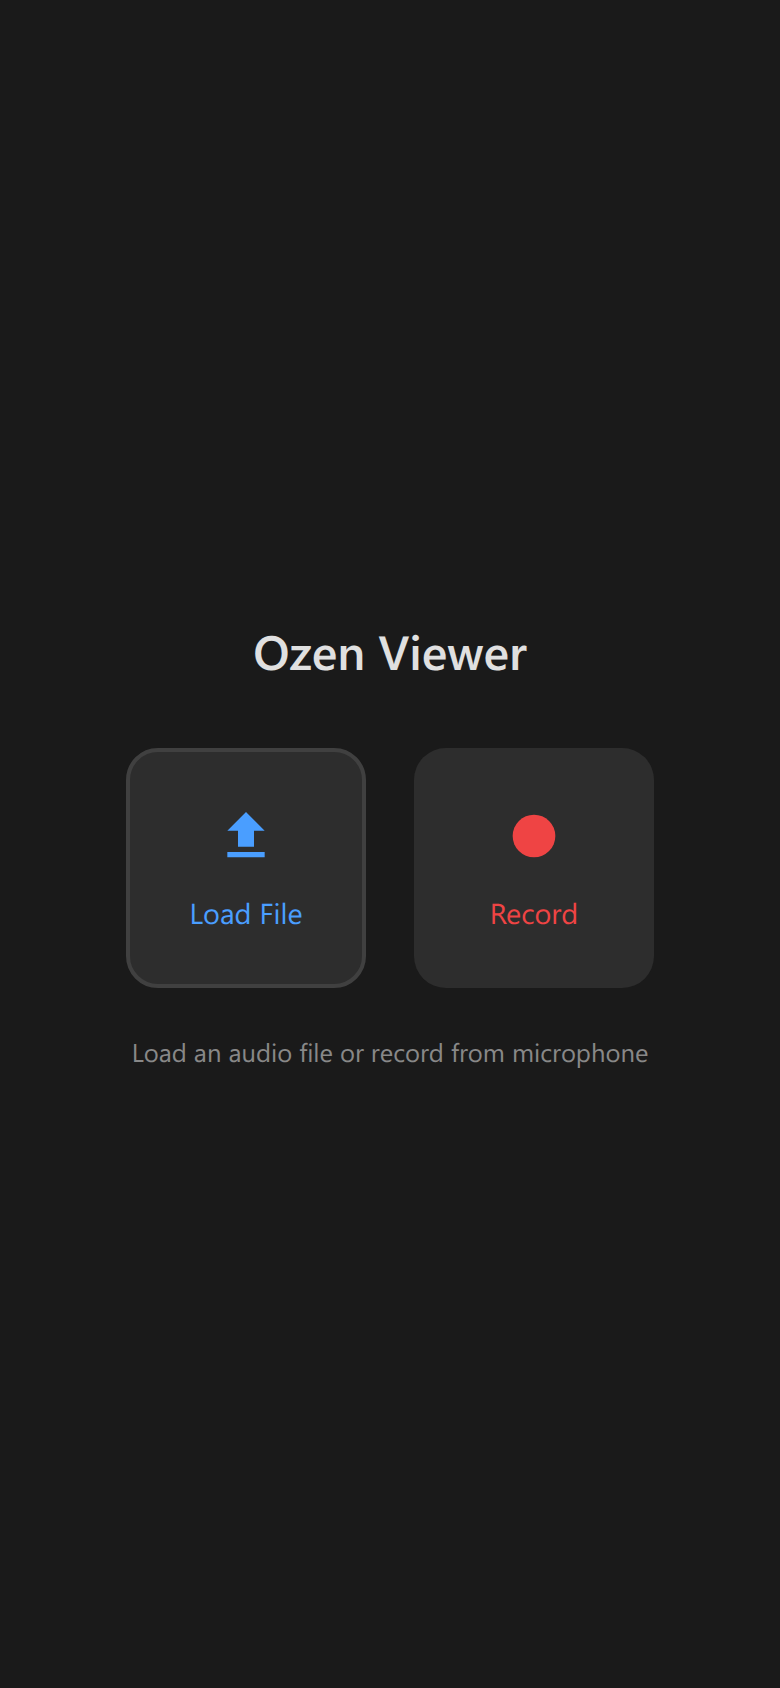
- Vertical layout
- Spectrogram above waveform
- Values bar at top
- Settings drawer from right
- Suitable for phones
Landscape Mode
- Horizontal layout optimized for viewing
- Wider spectrogram view
- Settings drawer from right
- Better for detailed analysis
- Recommended for tablets
The viewer automatically adapts layout when device is rotated. No refresh required.
Safe Area Handling
The viewer respects device safe areas:
- iPhone notches - Content avoids notch and Dynamic Island
- Rounded corners - UI elements stay within safe bounds
- Home indicator - Bottom spacing on iOS devices
This ensures all controls are accessible on modern smartphones.
URL Audio Loading
The mobile viewer can load audio from URLs, enabling sharing and embedding:
Direct Audio URLs
/viewer?audio=https://example.com/recording.wavCORS requirements: - Server must allow cross-origin requests - Set Access-Control-Allow-Origin: * header - Works with GitHub Pages, S3, most CDNs
Data URLs
Embed audio directly in URL (self-contained):
/viewer?audio=data:audio/wav;base64,UklGR...Use cases: - Share analysis without hosting files - Embed in QR codes - Create self-contained examples
See Embedding Guide for details.
Embedding in Web Pages
Embed the mobile viewer in responsive web pages. Here’s a live example:
Embed code:
<iframe src="https://ucpresearch.github.io/ozen-web/viewer.html?audio=...&overlays=pitch,formants"
        style="width: 100%; height: 600px; border: none;">
</iframe>
The viewer scales appropriately within iframes.
Limitations
View-only mode - The mobile viewer does not support:
- ❌ Adding annotation boundaries
- ❌ Editing TextGrid labels
- ❌ Adding data points
- ❌ Exporting files
- ❌ Microphone recording
For full editing features, use the desktop interface.
Why view-only? - Touch gestures conflict with editing operations - Prevents accidental edits on mobile - Focuses on analysis and presentation - Simpler, more stable interface
Performance
The mobile viewer works on mobile devices:
| Feature | Mobile Optimization |
|---|---|
| Spectrogram | On-demand computation for visible region |
| Waveform | Downsampled for fast rendering |
| Overlays | Computed only when toggled on |
| Touch response | Debounced for smooth interaction |
Battery usage: - Minimal CPU when static - GPU-accelerated canvas rendering where supported - Pauses computation when app backgrounded
Browser Support
Works on all modern mobile browsers.
Use Cases
- “On the road” acoustic analysis
- Teaching
- Student engagement in class
Troubleshooting
Audio Won’t Load from URL
Problem: ?audio= parameter doesn’t load audio
Possible causes: - CORS not enabled on server - Invalid URL - Mixed content (HTTP audio on HTTPS page)
Solution: - Ensure server sends Access-Control-Allow-Origin header - Use HTTPS for both page and audio URL - Test URL in browser first - Try data URL instead
Touch Gestures Not Working
Problem: Pinch or drag doesn’t respond
Possible causes: - Browser zoom enabled (conflicts with pinch) - Touch events blocked by CSS - Old browser version
Solution: - Disable browser zoom (use in-app zoom instead) - Update to latest browser version - Try different browser (Chrome recommended)
Values Bar Shows “—”
Problem: Measurements show dashes instead of values
Explanation: - Normal for unvoiced regions (pitch undefined) - Overlays may need to be enabled - May be in silent region
Solution: - Enable desired overlays in settings drawer - Tap on region with audio - Wait for spectrogram to compute
See Also
- Embedding: Basic Usage - How to embed the viewer
- URL Parameters - Complete parameter reference
- Embedding Examples - Real-world examples