Waveform
Amplitude-domain visualization
Overview
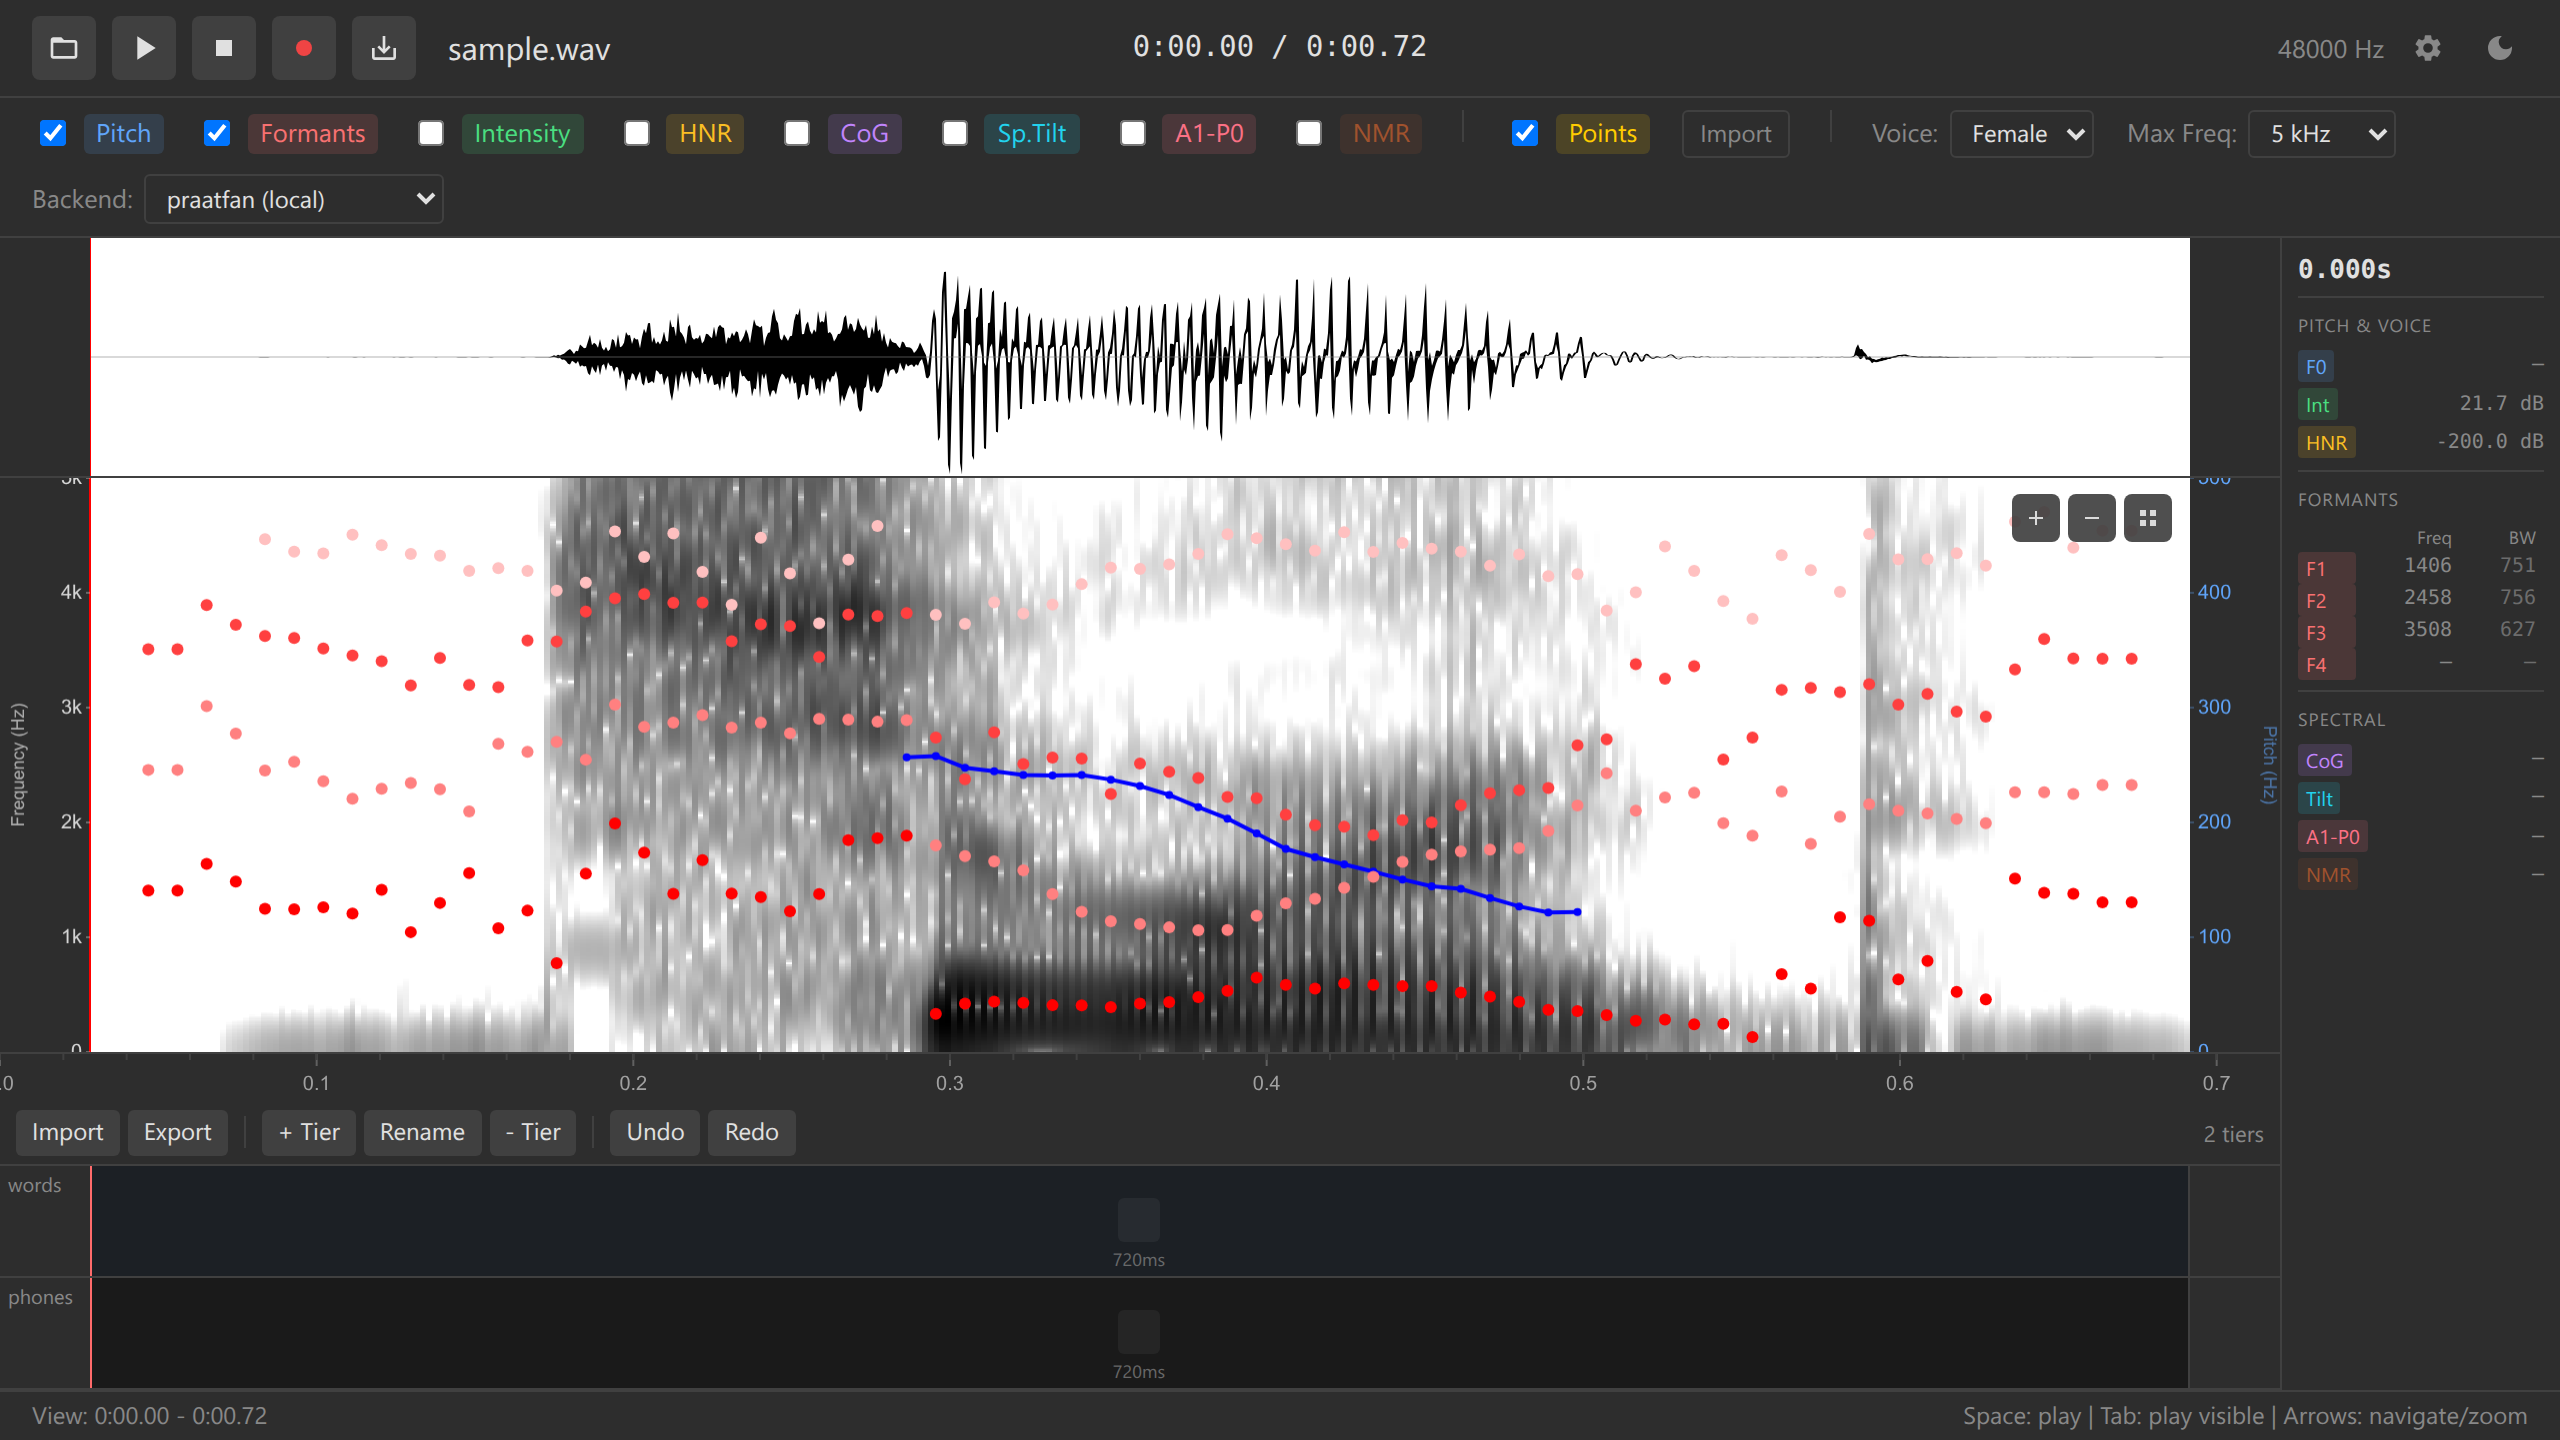
The waveform displays audio amplitude over time, providing a complementary view to the spectrogram. It’s useful for identifying silence, amplitude modulation, and overall signal structure.
Key Features
- Synchronized with spectrogram - Both views share the same time axis
- Full file visualization - Works with arbitrarily long recordings
- Amplitude scaling - Auto-scales to maximum amplitude
- Downsampled rendering - Efficient display at any zoom level
- Interactive - Click to place cursor, drag to select
Display
The waveform shows:
- Positive amplitude (above centerline)
- Negative amplitude (below centerline)
- Filled area - Shaded region between positive and negative peaks
Visual properties: - Dark gray filled waveform - Light background - Synchronized with time axis
Downsampling Strategy
For efficient rendering at any zoom level, the waveform uses min/max downsampling:
- Divide visible time range into pixel columns
- For each pixel column, find min and max sample values
- Draw vertical line from min to max
- Fill area creates solid waveform appearance
This approach: - Preserves all peaks and zero-crossings - Renders for files of any length - Shows full detail when zoomed in - Prevents aliasing artifacts
Interaction
Cursor Placement
Click anywhere on waveform to place cursor at that time position. Cursor synchronizes across waveform and spectrogram.
Time Selection
Click and drag horizontally to select time region:
- Click starting point
- Hold and drag to end point
- Release to finalize selection
- Selected region highlights in blue
Keyboard: - Space - Play selection (if selected) or visible window - Escape - Clear selection
Zoom and Pan
- Scroll wheel - Zoom in/out (centered on cursor)
- Horizontal scroll - Pan left/right through time
- Waveform and spectrogram zoom/pan together
Use Cases
Identifying Silence
Waveform clearly shows silent regions where amplitude approaches zero. Useful for:
- Detecting recording start/end
- Finding pauses between utterances
- Identifying segment boundaries
Amplitude Modulation
Waveform visualizes amplitude changes over time:
- Peaks - Vowels, stressed syllables
- Valleys - Consonants, unstressed syllables
- Gradual changes - Prosodic phrase structure
Clipping Detection
Waveform shows if audio clips (reaches maximum amplitude):
- Flat tops/bottoms - Signal clipping, indicates distortion
- Smooth peaks - Proper levels, no clipping
If waveform shows flat-topped peaks, the recording clipped during capture. This distortion cannot be removed. Use the original recording with lower gain settings.
Period Detection
When zoomed to millisecond scale, waveform shows individual periods of voiced sounds:
- Count zero-crossings to estimate fundamental frequency
- Visualize individual pitch periods
- Detect aperiodicity (e.g., creaky voice, vocal fry)
Configuration
Waveform appearance can be customized via config.yaml:
colors:
  waveform: "#333333"       # Waveform fill color
  waveformBackground: "#FFFFFF"  # Background
Performance
Waveform rendering uses efficient downsampling for files of any length.
Limitations
Current version: - Read-only (no waveform editing) - Single channel (stereo files mix to mono) - No waveform envelope extraction
Future enhancements: - Stereo waveform (dual channel display) - Amplitude envelope overlay - Waveform colorization by intensity
See Also
- Spectrogram - Frequency-domain visualization
- Audio Playback - Playing audio
- Tutorial: Exploring Audio - Navigation guide